Category Archives: Mortgage Rates

North County and San Diego Housing Markets October 2025

North County and San Diego Housing Markets October 2025 by Pam Fraser. Chart of home sales statistics in North San Diego County as of September 2025.

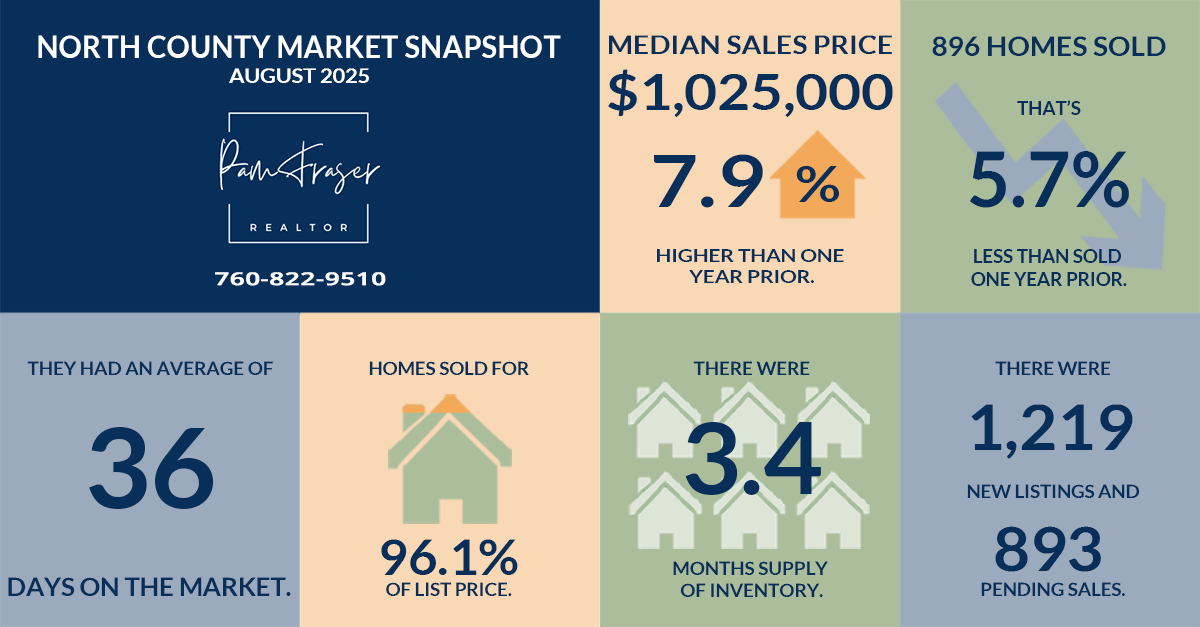
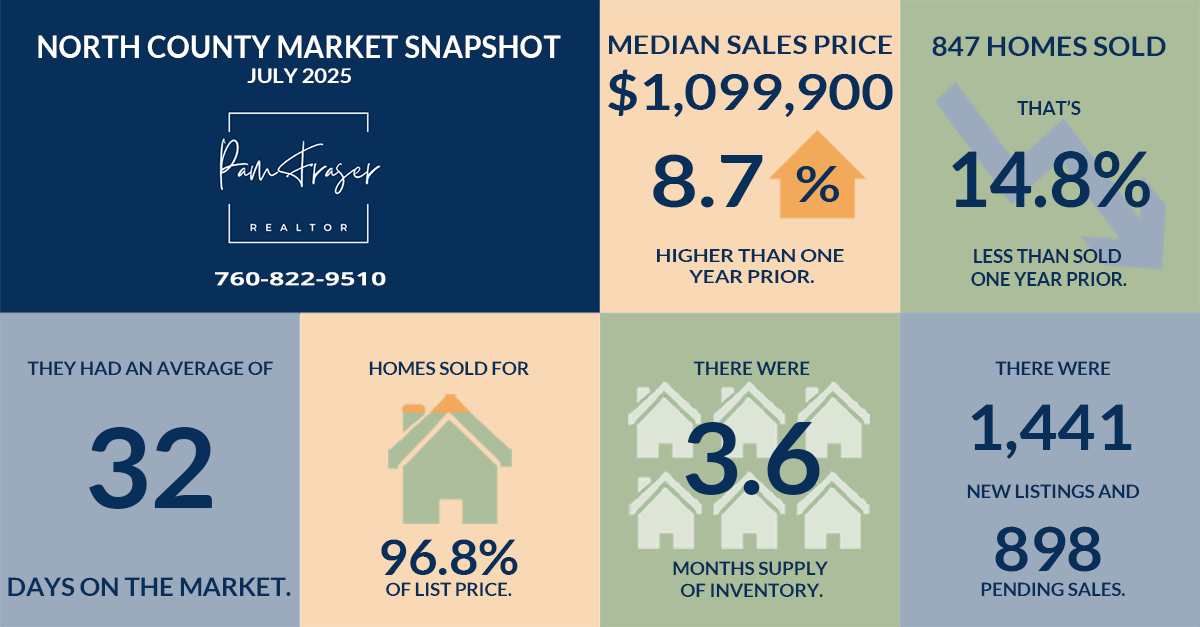
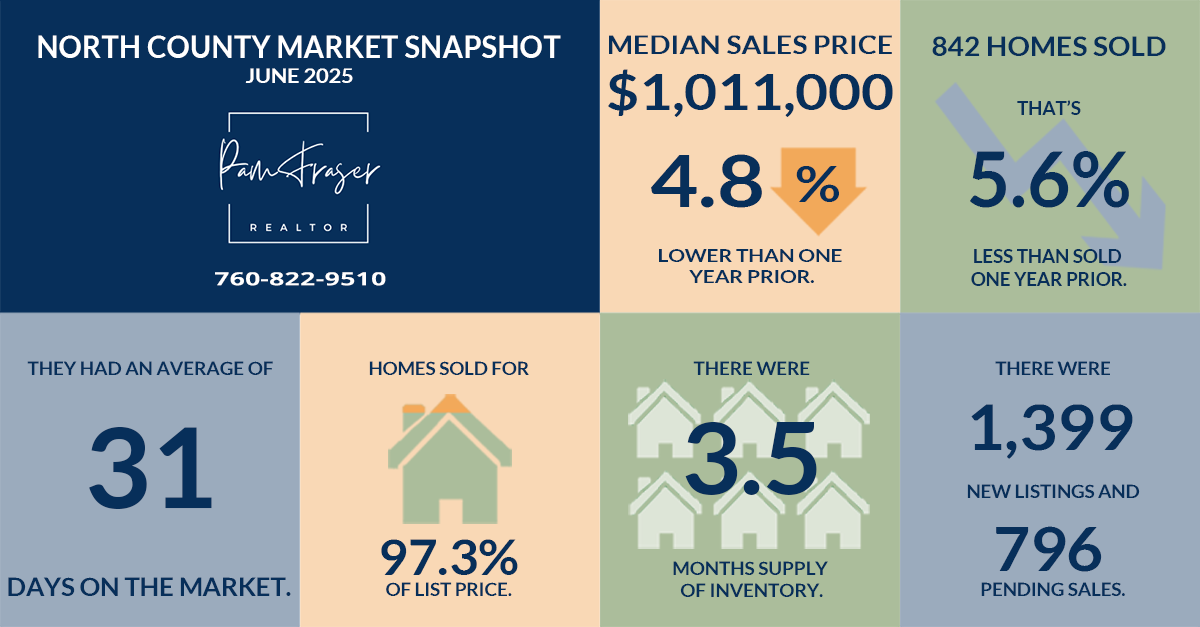
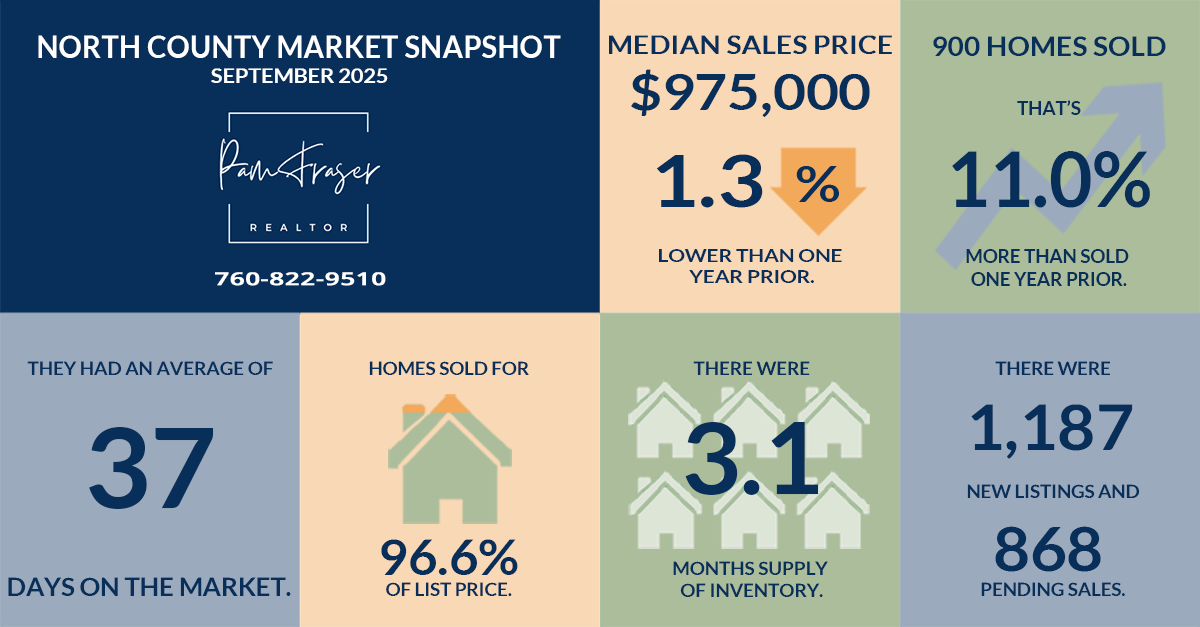
Year-over prices in the North County and the San Diego housing markets showed little change in September. The median sales price is very close to where it stood in March 2024, although inventory levels have doubled since then. But unlike other regions where active listings have plateaued, our local inventory has decreased for two consecutive months. This decline in available homes, coupled with lower mortgage rates continues to give sellers a slight advantage in the market.

Continue reading North County and San Diego Housing Markets October 2025

North County and San Diego Housing Markets September 2025

North County and San Diego Housing Markets September 2025 by Pam Fraser. Chart of home sales statistics in North San Diego County as of August 2025

The North County and San Diego housing markets both saw year-over price increases, though median values remain near spring levels. A slowdown in new listings has kept summer inventory from expanding. However, homes are taking longer to sell and sellers are securing lower sales prices relative to their asking prices.

Continue reading North County and San Diego Housing Markets September 2025

North County and San Diego Housing Markets August 2025

North County and San Diego Housing Markets August 2025 by Pam Fraser. Chart of home sales statistics in North San Diego County as of July 2025

In July, year-over prices in the San Diego housing market remained flat, while North County posted solid gains that helped offset three consecutive months of year-over declines. Closed sales fell in both markets, and sellers received a smaller percentage of their original asking price at closing. Although the supply of homes for sale continues to grow, inventory remains historically low.

Continue reading North County and San Diego Housing Markets August 2025

North County and San Diego Housing Markets July 2025

North County and San Diego Housing Markets July 2025 by Pam Fraser. Chart of home sales statistics in North San Diego County as of June 2025

In June, a month typically known for price growth, both the North County and San Diego housing markets saw month-over and year-over prices drop. As one Realtor I spoke with put it, “Shift happens.” And we’re definitely seeing that shift toward a more balanced market. While inventory remains relatively low, it is steadily increasing. Homes are staying on the market longer, and sellers are receiving a smaller percentage of their asking prices.

Continue reading North County and San Diego Housing Markets July 2025

Real Estate Market Update: What Mid-Year Indicators Mean for Your Next Move

Real Estate Market Update: What Mid-Year Indicators Mean for Your Next Move Pam Fraser. Aerial picture of two rows of single family homes.

As we reach the midpoint of 2025, the U.S. housing market stands at a critical juncture. The frenzy of the pandemic-era real estate boom has long since cooled, but in its place, we’re seeing a market searching for balance. Higher mortgage rates, cautious buyers, and rising home inventory are combining to reshape what it means to buy or sell a home in today’s climate.

Continue reading Real Estate Market Update: What Mid-Year Indicators Mean for Your Next Move

North County and San Diego Housing Markets June 2025

North County and San Diego Housing Markets June 2025 by Pam Fraser.   Chart of home sales statistics in North San Diego County as of May 2025.

Although we did see month-over gains, year-over prices in the North County and San Diego housing markets remained flat or have decreased slightly.

Continue reading North County and San Diego Housing Markets June 2025

North County and San Diego Housing Markets May 2025

North County and San Diego Housing Markets May 2025 by Pam Fraser.  Chart of home sales statistics in North San Diego County as of April 2025.

Both the North County and San Diego housing markets experienced month-over-month increases in median home prices. However, compared to last year, prices have declined in both areas. Housing inventory has now increased for four consecutive months and is significantly higher than it was a year ago.

Continue reading North County and San Diego Housing Markets May 2025

North County and San Diego Housing Markets April 2025

North County and San Diego Housing Markets April 2025. Chart of home sales statistics in North San Diego County as of March 2025.

Although prices are still showing moderate increases in both the North County and San Diego housing markets, market times increased by 20 percent compared to the previous year and supply continued to grow.

Continue reading North County and San Diego Housing Markets April 2025

North County and San Diego Housing Markets March 2025

North County and San Diego Housing Markets March 2025 by Pam Fraser. Chart of home sales statistics in North San Diego County.

Median home prices continued to creep up in both the North County and San Diego housing markets. And while homes stayed on the market quite a bit longer than they did a year ago, market times shortened compared to January.

Continue reading North County and San Diego Housing Markets March 2025

North County and San Diego Housing Markets February 2025

North County and San Diego Housing Markets February 2025 by Pam Fraser. Chart of home sales statistics in January 2025 in North County

January sales ticked up in both the North County and San Diego housing markets, but the number of new listings was almost double the number of pending sales. While housing inventory here remains very low at just two months, this may be an indicator that it’s increasing. This aligns with national trends, where housing inventory is now up to five months.

Continue reading North County and San Diego Housing Markets February 2025